e&p
IL
I TUMORI
CANCROININITALIA
ITALIA-RAPPORTO
- RAPPORTO 2008
2006
VIIIc Sarcoma di Ewing
Schede specifiche per tumore Cancer-specific figures
Ewing’s sarcoma
I sarcomi di Ewing costituiscono il 2% dei casi di tumore in età pediatrica registrati nella banca dati AIRTUM nel 1998-2002 e il 38% dei
tumori dell’osso, con un tasso di incidenza (TI) standardizzato per età
di 2,9 casi per milione di bambini per anno (IC 95% 1,9-3,9) (TI standardizzato per età sulla popolazione europea 2,8; IC 95% 1,0-4,7). Tutti i casi sono stati diagnosticati istologicamente.
Il rischio cumulativo fino a 14 anni di età di sviluppare un tumore maligno dell’osso è stato 0,04 per mille (IC 95% 0,03-0,05).
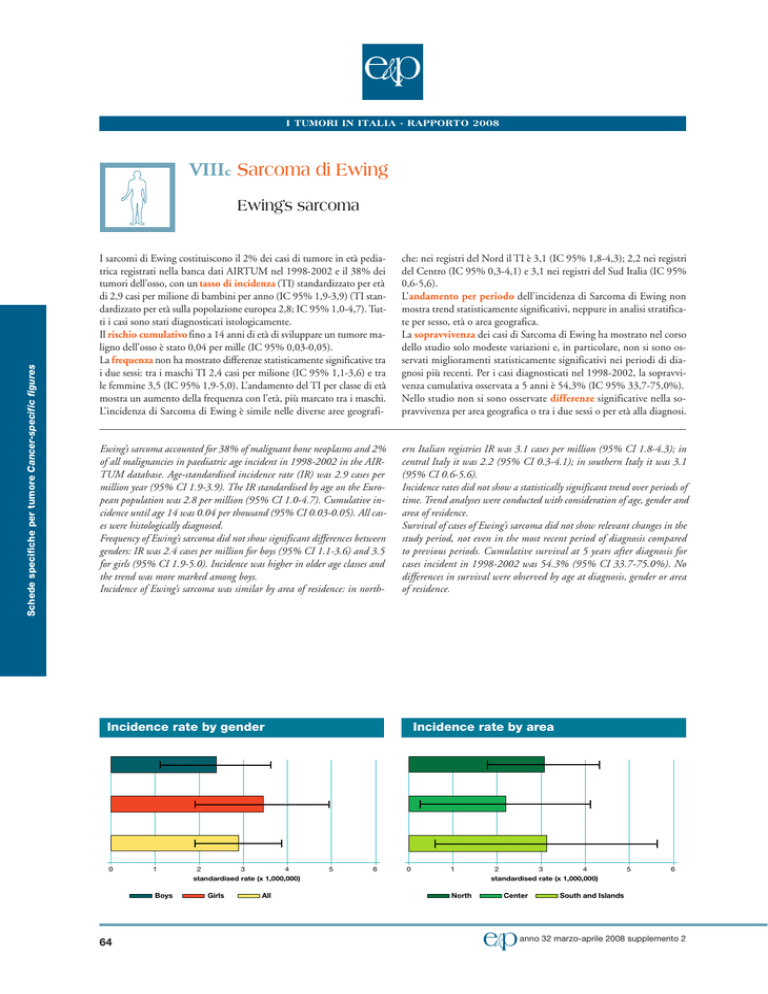
La frequenza non ha mostrato differenze statisticamente significative tra
i due sessi: tra i maschi TI 2,4 casi per milione (IC 95% 1,1-3,6) e tra
le femmine 3,5 (IC 95% 1,9-5,0). L’andamento del TI per classe di età
mostra un aumento della frequenza con l’età, più marcato tra i maschi.
L’incidenza di Sarcoma di Ewing è simile nelle diverse aree geografi-
che: nei registri del Nord il TI è 3,1 (IC 95% 1,8-4,3); 2,2 nei registri
del Centro (IC 95% 0,3-4,1) e 3,1 nei registri del Sud Italia (IC 95%
0,6-5,6).
L’andamento per periodo dell’incidenza di Sarcoma di Ewing non
mostra trend statisticamente significativi, neppure in analisi stratificate per sesso, età o area geografica.
La sopravvivenza dei casi di Sarcoma di Ewing ha mostrato nel corso
dello studio solo modeste variazioni e, in particolare, non si sono osservati miglioramenti statisticamente significativi nei periodi di diagnosi più recenti. Per i casi diagnosticati nel 1998-2002, la sopravvivenza cumulativa osservata a 5 anni è 54,3% (IC 95% 33,7-75,0%).
Nello studio non si sono osservate differenze significative nella sopravvivenza per area geografica o tra i due sessi o per età alla diagnosi.
Ewing’s sarcoma accounted for 38% of malignant bone neoplasms and 2%
of all malignancies in paediatric age incident in 1998-2002 in the AIRTUM database. Age-standardised incidence rate (IR) was 2.9 cases per
million year (95% CI 1.9-3.9). The IR standardised by age on the European population was 2.8 per million (95% CI 1.0-4.7). Cumulative incidence until age 14 was 0.04 per thousand (95% CI 0.03-0.05). All cases were histologically diagnosed.
Frequency of Ewing’s sarcoma did not show significant differences between
genders: IR was 2.4 cases per million for boys (95% CI 1.1-3.6) and 3.5
for girls (95% CI 1.9-5.0). Incidence was higher in older age classes and
the trend was more marked among boys.
Incidence of Ewing’s sarcoma was similar by area of residence: in north-
ern Italian registries IR was 3.1 cases per million (95% CI 1.8-4.3); in
central Italy it was 2.2 (95% CI 0.3-4.1); in southern Italy it was 3.1
(95% CI 0.6-5.6).
Incidence rates did not show a statistically significant trend over periods of
time. Trend analyses were conducted with consideration of age, gender and
area of residence.
Survival of cases of Ewing’s sarcoma did not show relevant changes in the
study period, not even in the most recent period of diagnosis compared
to previous periods. Cumulative survival at 5 years after diagnosis for
cases incident in 1998-2002 was 54.3% (95% CI 33.7-75.0%). No
differences in survival were observed by age at diagnosis, gender or area
of residence.
Incidence rate by gender
0
1
Boys
64
2
3
4
standardised rate (x 1,000,000)
Girls
All
Incidence rate by area
5
6
0
1
North
2
3
4
standardised rate (x 1,000,000)
Center
e&p
5
6
South and Islands
anno 32 marzo-aprile 2008 supplemento 2
15
rate x 1,000,000
10
5
0
0
1-4
5-9
10-14
age group
Boys
Girls
All
Sede / Site (ICDO v.2)
n
%
C40.0 Scapula and long bones of upper limb
5
14.7%
C40.1 Short bones of upper limb
1
2.9%
C40.2 Long bones of lower limb
8
23.5%
C40.3 Short bones of lower limb
2
5.9%
C40.9 Bone and articular cartilage of limb, unspecified
1
2.9%
C41.0 Bones of skull and face
1
2.9%
C41.1 Mandible
2
5.9%
C41.2 Vertebral column
3
8.8%
C41.3 Ribs, sternum and clavicle
5
14.7%
C41.4 Pelvic bones, sacrum and coccyx
Incidence trend by gender
Total
5,0
4,0
3,5
3,0
2,5
Age
n.
group cases
2,0
1,5
1,0
1993-1997
Boys
Girls
1998-2002
■■ APC: 1.0% (IC95% -5.5%,8.0%)
6
3
1-4
9
88.9 (68.4-100.0)
66.7 (35.9-97.5)
66.7 (35.9-97.5)
5-9
7
100.0 (100.0-100.0)
66.7 (28.9-100.0)
33.3
10-14
17
100.0 (100.0-100.0)
73.4 (50.6-96.2)
53.5 (24.6-82.5)
Period
■■ APC: 7.1% (IC95% -10.0%,5.3%)
■■ APC: -4.0% (IC95% -13.8%,6.8%)
■■ APC: not calculable
2
1
0 years (n=1)
0
1988-1992
Years:
1993-1997
0
(0.0-83.2)
Sopravvivenza cumulativa a 3, 5, 10 e 15 anni dalla diagnosi
per i casi di sarcoma di Ewing diagnosticati nel periodo
1988-2002, per periodo di diagnosi. Fonte: banca dati AIRTUM.
Cumulative survival at 3, 5, 10 and 15 years after diagnosis
for children affected by Ewing’s sarcoma incident in 1988-2002,
by period of diagnosis. Data from the AIRTUM database.
8
4
100.0 (100.0-100.0)
Log-rank test: p= 0.8532
All
Incidence trend by age
5
100.0 (100.0-100.0) 100.0 (100.0-100.0)
5 y (95%CI)
1
■■ APC: -2.0% (IC95% -10.0%,5.3%)
1988-1992
Cumulative survival
3 y (95%CI)
1 y (95%CI)
0
■■ APC: 3.8% (IC95% -3.0%,11.5%)
5,0
7
17.6%
100.0%
Sopravvivenza cumulativa a 1, 3 e 5 anni dalla diagnosi
per i casi di sarcoma di Ewing diagnosticati nel periodo
1998-2002, per classe di età. Fonte: banca dati AIRTUM.
Cumulative survival at 1, 3, and 5 years after diagnosis for children affected
by Ewing’s sarcoma incident in 1998-2002. Data from the AIRTUM database.
4,5
0,5
6
34
1-4
1998-2002
5-9
n.
cases
3y
(95%CI)
Cumulative survival
5y
10 y
(95%CI)
(95%CI)
15 y
(95%CI)
1988
1992
27
77.8
(62.1-93.5)
63.0
(44.7-81.2)
51.9
(33.0-70.7)
51.9
(33.0-70.7)
1993
1997
39
81.6
(69.3-93.9)
76.3
(62.8-89.8)
68.3
(53.5-83.1)
-
1998
2002
34
70.9
(54.8-87.1)
54.3
(33.7-75.0)
-
-
Log-rank test: p= 0.2872
10-14
Cumulative survival by period
cumulative survival
cumulative survival
Cumulative survival by age
years after diagnosis
➤ Ulteriori dati sono disponibili presso: www.registri-tumori.it
years after diagnosis
65
Schede specifiche per tumore Cancer-specific figures
Distribuzione percentuale e numero di casi di sarcoma di Ewing
nella banca dati AIRTUM, 1998-2002, per sede della neoplasia.
Number of cases of Ewing’s sarcoma incident in 1998-2002 in paediatric
age in the AIRTUM database. Frequency distribution by tumour site.
Incidence rate by age and gender

