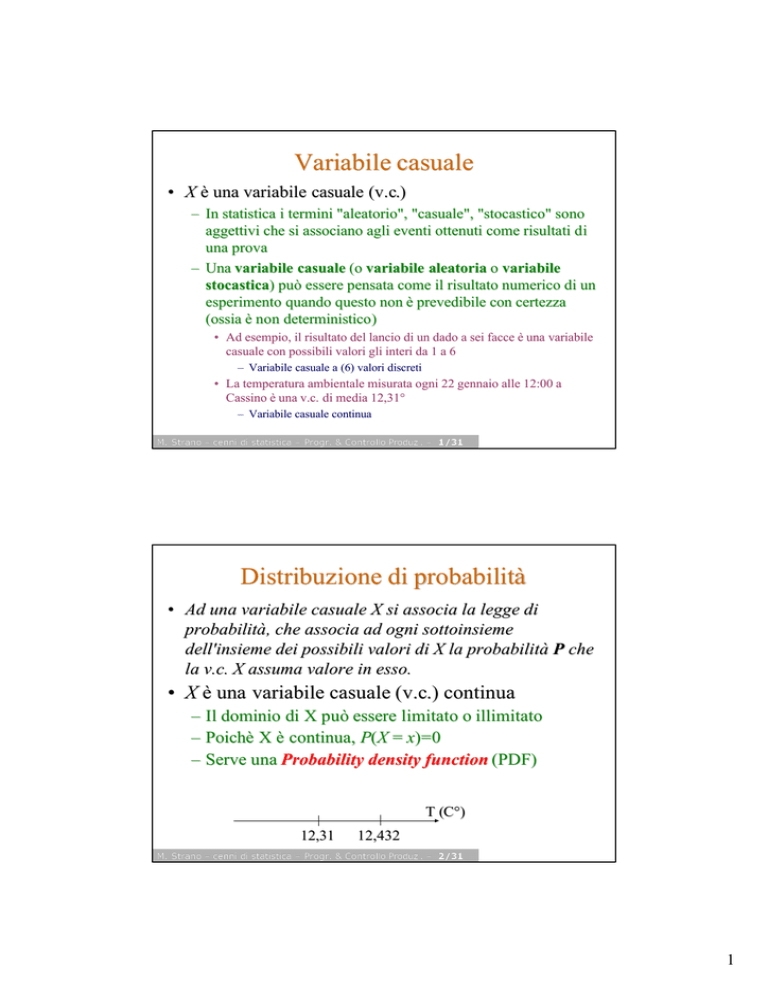
Variabile casuale
• X è una variabile casuale (v.c.)
v.c.)
– In statistica i termini "aleatorio", "casuale", "stocastico" sono
aggettivi che si associano agli eventi ottenuti come risultati di
di
una prova
– Una variabile casuale (o variabile aleatoria o variabile
stocastica)
stocastica) può essere pensata come il risultato numerico di un
esperimento quando questo non è prevedibile con certezza
(ossia è non deterministico)
deterministico)
• Ad esempio, il risultato del lancio di un dado a sei facce è una variabile
casuale con possibili valori gli interi da 1 a 6
– Variabile casuale a (6) valori discreti
• La temperatura ambientale misurata ogni 22 gennaio alle 12:00 a
Cassino è una v.c. di media 12,31°
12,31°
– Variabile casuale continua
M. Strano – cenni di statistica – Progr
Progr.. & Controllo Produz . – 1/31
Distribuzione di probabilità
probabilità
• Ad una variabile casuale X si associa la legge di
probabilità
probabilità, che associa ad ogni sottoinsieme
dell'insieme dei possibili valori di X la probabilità
probabilità P che
la v.c. X assuma valore in esso.
• X è una variabile casuale ( v.c.)
v.c.) continua
– Il dominio di X può essere limitato o illimitato
– Poichè
Poichè X è continua, P(X = x)=0
– Serve una Probability density function (PDF)
T (C
(C°)
12,31
12,432
M. Strano – cenni di statistica – Progr
Progr.. & Controllo Produz . – 2/31
1
Distribuzioni continue
•X è una variabile casuale (v.c.)
v.c.) continua
– Probability density function (PDF)
• È una function f(x) con 3 proprietà
proprietà:
1. f(x) ≥ 0 for all real values x
– La densità
densità di probabilità
probabilità ovviamente è positiva
2.For
2.For any fixed a and b with a ≤ b, the probability
that X will fall between a and b is the area under
f(x) between a and b
M. Strano – cenni di statistica – Progr
Progr.. & Controllo Produz . – 3/31
Continuous Distributions
Proprietà
Proprietà 2:
Shaded Area is the Probability That X is Between a and b
0
a
b
x
M. Strano – cenni di statistica – Progr
Progr.. & Controllo Produz . – 4/31
2
Distribuzioni continue
•X è una variabile casuale (v.c.)
v.c.) continua
– Probability density function (PDF)
• È una function f(x) con 3 proprietà
proprietà:
1. f(x) ≥ 0 for all real values x
– La densità
densità di probabilità
probabilità ovviamente è positiva
2.For
2.For any fixed a and b with a ≤ b, the probability
that X will fall between a and b is the area under
f(x) between a and b:
3.The
3.The total area under f(x)
f(x) is 1:
M. Strano – cenni di statistica – Progr
Progr.. & Controllo Produz . – 5/31
Continuous Distributions
Proprietà
Proprietà 3:
tutta l’area sottesa rappresenta tutta la probabilità
probabilità e quindi
è uguale al 100%, cioè
cioè 1
0
x
-∞
+∞
M. Strano – cenni di statistica – Progr
Progr.. & Controllo Produz . – 6/31
3
Continuous Distributions (cont
(cont’’d.)
• Cumulative distribution function (CDF) - probability that
the v.c.
v.c. will be ≤ a fixed value x:
• Properties of continuous CDFs
–
–
–
–
–
0 ≤ F(x ) ≤ 1 for all x
As x → –∞, F(x) → 0
F(x)
As x → +∞, F(x ) → 1
F(x) is nondecreasing in x
0
x
F(x) is a continuous function with slope equal to the PDF:
f(x) = F'(x)
M. Strano – cenni di statistica – Progr
Progr.. & Controllo Produz . – 7/31
Continuous Distributions (cont
(cont’’d.)
• Cumulative distribution function (CDF) - probability that
the v.c.
v.c. will be ≤ a fixed value x:
= F(b)F(b)-F(a)
0
M. Strano – cenni di statistica – Progr
Progr.. & Controllo Produz . – 8/31
a
b
F(a)
F(b)
4
Expected Values, Variances, and Standard
Deviations
• Valor atteso or mean of X is
– Media pesata,
pesata, tramite il peso f(x),
f(x), della variabile casuale
• Variance of X is
– Media pesata,
pesata, tramite f(x),
f(x), della distanza al quadrato della
variabile casuale dalla sua media
0.4
0.3
0.2
0.1
0.0
µ
x
M. Strano – cenni di statistica – Progr
Progr.. & Controllo Produz . – 9/31
Expected Values, Variances, and Standard
Deviations
• Valor atteso or mean of X is
• Variance of X is
• Standard deviation of X is
0.4
Distribuzione normale
0.3
f ( x) =
0.2
0.1
0.0
µ
1
2πσ 2
x
e −( x −µ )
2
/ 2σ 2
X ~ N (µ ,σ 2 )
M. Strano – cenni di statistica – Progr
Progr.. & Controllo Produz . – 10
10/31
/31
5
Expected Values, Variances, and Standard
Deviations
Effects of µ on the Probability Density Function
of a Normal Random Variable
0.4
X ~ N (5, σ 2 )
0.3
X ~ N (6, σ 2 )
0.2
0.1
0.0
1.5
2.5
3.5
4.5
5.5
6.5
7.5
x
8.5
M. Strano – cenni di statistica – Progr
Progr.. & Controllo Produz . – 11
11/31
/31
Expected Values, Variances, and Standard
Deviations
Effects of σ 2 on the Probability Density Function
of a Normal Random Variable
X ~ N ( µ , 0.0625)
0.4
0.3
0.2
X ~ N ( µ ,1)
0.1
0.0
1.5
2.5
3.5
4.5
5.5
6.5
7.5
8.5
x
M. Strano – cenni di statistica – Progr
Progr.. & Controllo Produz . – 12
12/31
/31
6
Expected Values, Variances, and Standard
Deviations
The Standard Normal Distribution
Let Z be a normal random variable with mean 0 and
variance 1; that is
Z ~ N (0,1)
We say that Z follows the standard normal distribution.
Denote the cumulative distribution function as F(z), and a
and b as two numbers with a < b,
b, then
P( a < Z < b ) = F (b) − F (a )
M. Strano – cenni di statistica – Progr
Progr.. & Controllo Produz . – 13
13/31
/31
Expected Values, Variances, and Standard
Deviations
The Standard Normal Distribution
se
X ~ N (µ ,σ 2 )
the random variable Z = (X - µ )/σ
)/σ has a
standard normal distribution: Z ~ N(0, 1)
M. Strano – cenni di statistica – Progr
Progr.. & Controllo Produz . – 14
14/31
/31
7
Sampling (campionamento
(campionamento))
• Il campionamento sta alla base della inferenza
statistica, la quale si divide in due grandi capitoli:
la stima e la verifica (o test)
test) d'ipotesi
• STIMA
– estimate or infer something about a population or
process based on only a sample from it
• Think of a R.V. with a distribution governing the population
• Random sample (campione)
campione) is a set of independent and
identically distributed (IID) observations X1, X2, …, Xn
• In simulation, sampling is making some runs of the model
and collecting the output data
• Don’
Don’t know parameters of population (or distribution) and
want to estimate them or infer something about them based
on the sample
M. Strano – cenni di statistica – Progr
Progr.. & Controllo Produz . – 15
15/31
/31
La stima campionaria
• Population parameter
– Population mean µ = E(X)
– Population variance σ 2
– Population proportion
• Parameter – need to
know whole population
• Fixed (but unknown)
• Sample estimate
– Sample mean
– Sample variance
– Sample proportion
• Sample statistic
– can be computed from a
sample
– Varies from one sample
to another – is a RV
itself, and has a
distribution, called the
sampling distribution
M. Strano – cenni di statistica – Progr
Progr.. & Controllo Produz . – 16
16/31
/31
8
Sampling Distributions
• Have a statistic, like sample mean or sample variance
– Its value will vary from one sample to the next
• The sample mean
Media campionaria
t=
n
x=
∑x
i
i =1
n
• The sample variance
Varianza campionaria
t=
n
s2 =
∑( x − x )
i =1
2
i
n −1
M. Strano – cenni di statistica – Progr
Progr.. & Controllo Produz . – 17
17/31
/31
Sampling Distributions
• Some samplingsampling-distribution results
– Sample mean
If
2
2
Regardless of distribution of X,
– Sample variance s2
E(s2) = σ2
n
è a sua volta una v.c.,
anch’essa distribuita
normalmente, se la
popolazione X è
normale
ma anche se X non è
normale, per i grandi
numeri è distribuita
normalmente
M. Strano – cenni di statistica – Progr
Progr.. & Controllo Produz . – 18
18/31
/31
9
La stima campionaria puntuale
• A sample statistic that estimates (in some sense) a
population parameter
• Properties
– Unbiased:
Unbiased: E(estimate) = parameter
– Efficient:
Efficient: Var(estimate)
Var(estimate) is lowest among competing
point estimators
– Consistent:
Consistent: Var(estimate)
Var(estimate) decreases (usually to 0) as
the sample size n increases
M. Strano – cenni di statistica – Progr
Progr.. & Controllo Produz . – 19
19/31
/31
Stima puntuale
popolazione
J
J
Mean, µ, is
unknown
J
campione
Mean J
JX = 50
I believe µ is
about 50
J J
Sample
J
J
J J
M. Strano – cenni di statistica – Progr
Progr.. & Controllo Produz . – 20
20/31
/31
10
Stima puntuale
Estimate Population
Parameter...
Mean
µ
Variance
Differences
σ
with Sample
Statistic
x
s2
2
µ1 - µ 2
x1 -x2
M. Strano – cenni di statistica – Progr
Progr.. & Controllo Produz . – 21
21/31
/31
Stima per intervalli
popolazione
J
J
Mean, µ, is
unknown
J
campione
Mean J
JX = 50
J J
I am 95%
confident that
µ is between
40 & 60.
Sample
J
J
J J
M. Strano – cenni di statistica – Progr
Progr.. & Controllo Produz . – 22
22/31
/31
11
La stima:
stima: Confidence Intervals
Lower Confidence
Limit
Point Estimate
Upper Confidence
Limit
0.95
confidence level =
=100 (1 – α)% =95%
α% =5%
z.025= -1.96
z.025= 1.96
M. Strano – cenni di statistica – Progr
Progr.. & Controllo Produz . – 23
23/31
/31
La stima:
stima: Confidence Intervals
• A point estimator is just a single number, with some
uncertainty or variability associated with it
• Confidence interval quantifies the likely imprecision in a
point estimator
– An interval that contains (covers
(covers)) the unknown population
parameter with specified (high) probability 1 – α
– Called a 100 (1 – α)% confidence interval for the parameter
• Confidence interval for the population mean µ:
M. Strano – cenni di statistica – Progr
Progr.. & Controllo Produz . – 24
24/31
/31
12
Confidence Interval
• Alcuni risultati
– Media campionaria
• Valore atteso
• Varianza
• Se
• Indipedentemente dalla distribuzione di X
– Varianza campionaria s2
• E(s2) = σ2
M. Strano – cenni di statistica – Progr
Progr.. & Controllo Produz . – 25
25/31
/31
Confidence Interval (σ nota,
nota, X normale)
normale)
se X~N(µ, σ) ⇒
⇒
-2.58 -1.96
-1.65
0
X −µ
= Z ~N(0,1)
σ
n
Ζ
1.65 1.96 2.58
90% Samples
95% Samples
99% Samples
M. Strano – cenni di statistica – Progr
Progr.. & Controllo Produz . – 26
26/31
/31
13
Confidence Interval
(σ nota,
nota, X normale)
normale)
− Zα /2 ≤
X −µ
≤ Zα /2
σ
n
α/2
X − Zα /2 ⋅
α/2
1-α
− Zα /2
0
Ζ
Zα /2
σ
σ
≤ µ ≤ X + Zα /2 ⋅
n
n
esempio
10
10
n = 25
95%
50 − 1 . 96 ⋅
≤ µ ≤ 50 + 1 . 96 ⋅
25
25
X = 50 confidence
interval for µ?
46 . 08 ≤ µ ≤ 53 . 92
σ = 10
M. Strano – cenni di statistica – Progr
Progr.. & Controllo Produz . – 27
27/31
/31
Confidence Interval for Mean
(σ non nota)
nota)
• Varianza campionaria s2
– E(s2) = σ2
X −µ X −µ X −µ
=
≈
σX
σ / n s/ n
– La variabile T =
X −µ
s/ n
segue una distribuzione t n-1 di Student con n-1 g.d.l.
g.d.l.
Intervallo di
confidenza al
100(1-α)%
X − tα / 2, n −1
s
n
, X + tα / 2, n−1
s
n
M. Strano – cenni di statistica – Progr
Progr.. & Controllo Produz . – 28
28/31
/31
14
Confidence Interval for Mean
(σ non nota)
nota)
Per n elevato (n>25) la
normale standardizzata e la t
di student coincidono
Standard
Normal
Student’
Student’s t Distributions
t (df
(df = 13)
t (df
(df = 5)
Z
t
0
M. Strano – cenni di statistica – Progr
Progr.. & Controllo Produz . – 29
29/31
/31
Confidence Interval for Mean
(σ non nota)
nota)
Student’’s
Student s
t Table
v
t.10
.10
t.05
.05
t.025
.025
Assume:
n=3
df = n - 1 = 2
α = .10
α/2 =.05
α/2
1 3.078 6.314 12.706
2 1.886 2.920 4.303
3 1.638 2.353 3.182
t values
.05
0
2.920
t
M. Strano – cenni di statistica – Progr
Progr.. & Controllo Produz . – 30
30/31
/31
15
Confidence Interval for Mean
Possibili casi
σ nota
X~N(µ,σ
~N(µ,σ2)
∀n
σ nota
X qualunque
n > 25
Intervallo di
confidenza costruito
tramite Z
σ non nota
X~N(µ,σ
~N(µ,σ2)
n ≤ 25
X non normale
n ≤ 25
?
Intervallo di confidenza
costruito tramite T
M. Strano – cenni di statistica – Progr
Progr.. & Controllo Produz . – 31
31/31
/31
16

