PRELIMINARY SPATIAL MODELLING OF WEST NILE VIRUS
CIRCULATION IN PIANURA PADANA, NORTHERN ITALY, 2013
Alessandro Albieri, Romeo Bellini
Centro Agricoltura Ambiente "G.NICOLI", Medial and Veterinary Entomology Dept., Crevalcore (BO), Italy
Mattia Calzolari, Michele Dottori, Paolo Bonilauri - IZSLER, Brescia, Italy
Gioia Capelli, Fabrizio Montarsi, Paolo Mulatti - IZSVe, Legnaro (PD), Italy
Cristina Casalone, Alessandra Pautasso, Maria Cristina Radaelli - IZSTO, Torino, Italy
Introduction
West Nile Virus (WNV) is an emerging threat in Europe, with more than 800 human cases reported since 2010 in the European Union.
WNV was detected in Italy in 1998 in Padule di Fucecchio (Tuscany), without human cases recorded, then, after ten years, WNV
reappeared northward in Pianura Padana in 2008-2009 affecting Emilia-Romagna, Veneto, Lombardia regions where human cases
were recorded. The virus was continuously detected in subsequent years until 2013, with different strains over the years and in
different areas of the Pianura Padana.
The environmental surveillance, particularly based on entomological and bird sampling, is performing well in the early detection of
virus circulation, before the appearance of human and equine cases. For this reason, besides the activities supported by the Ministry
of Health at national level, more detailed surveillance programs were carried out in Pianura Padana at regional level starting in 2008.
For the first time in 2013 five neighboring Regions of Northern Italy activated a similar entomological surveillance, allowing the
monitoring of the whole Pianura Padana territory (of about 46,000 Km2).
Spatial Modelling Maps and discussion
We created WNV circulation maps of Pianura Padana using two
modelling approaches based on mosquito data: one exploratory
analysis based on KDE (Kernel Density Estimation) and one statistical
approach based on NLDA (Non Linear Discriminant Analysis) largely
used on species distribution and on epidemic risk.
KDE analysis is a geospatial technique based on the kernel function
(Gaussian function) used to create a surface to indicate the intensity of
the events of the phenomenon. The optimum bandwidth size of 20 km
was calculated using BVC (Biased Cross Validation). The area of WNV
circulation was estimated by the 95% volume contour of the WNV KDE
that represents the boundary of the area that contains 95% of the
volume of the obtained KDE distribution, and would therefore contain,
on average, 95% of the points used to generate the KDE.
NLDA is a spatial model applied to presence/absence positive pools as
dependent variable correlated to about 100 environmental and climatic
variables at 1 km resolution. Features of the Regional entomological
plans of surveillance are elsewhere described (Calzolari et al. 2013,
Capelli et al. 2013, Pautasso et al. 2013), salient characteristic are
reported in table below.
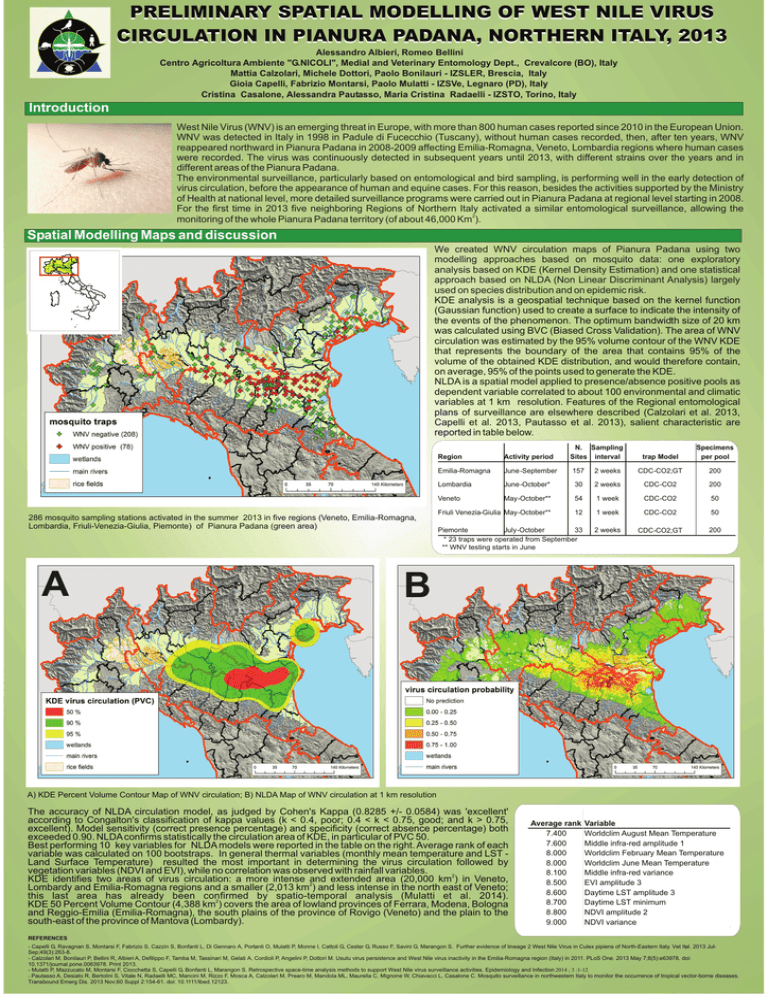
286 mosquito sampling stations activated in the summer 2013 in five regions (Veneto, Emilia-Romagna,
Lombardia, Friuli-Venezia-Giulia, Piemonte) of Pianura Padana (green area)
A
Region
Activity period
Emilia-Romagna
June-September
Lombardia
Veneto
N. Sampling
Sites interval
trap Model
Specimens
per pool
157
2 weeks
CDC-CO2;GT
200
June-October*
30
2 weeks
CDC-CO2
200
May-October**
54
1 week
CDC-CO2
50
Friuli Venezia-Giulia May-October**
12
1 week
CDC-CO2
50
Piemonte
July-October
33
* 23 traps were operated from September
** WNV testing starts in June
2 weeks
CDC-CO2;GT
200
B
A) KDE Percent Volume Contour Map of WNV circulation; B) NLDA Map of WNV circulation at 1 km resolution
The accuracy of NLDA circulation model, as judged by Cohen's Kappa (0.8285 +/- 0.0584) was 'excellent'
according to Congalton's classification of kappa values (k < 0.4, poor; 0.4 < k < 0.75, good; and k > 0.75,
excellent). Model sensitivity (correct presence percentage) and specificity (correct absence percentage) both
exceeded 0.90. NLDA confirms statistically the circulation area of KDE, in particular of PVC 50.
Best performing 10 key variables for NLDA models were reported in the table on the right. Average rank of each
variable was calculated on 100 bootstraps. In general thermal variables (monthly mean temperature and LST Land Surface Temperature) resulted the most important in determining the virus circulation followed by
vegetation variables (NDVI and EVI), while no correlation was observed with rainfall variables.
KDE identifies two areas of virus circulation: a more intense 2and extended area (20,000 km2) in Veneto,
Lombardy and Emilia-Romagna regions and a smaller (2,013 km ) and less intense in the north east of Veneto;
this last area has already been confirmed by spatio-temporal analysis (Mulatti et al. 2014).
KDE 50 Percent Volume Contour (4,388 km2) covers the area of lowland provinces of Ferrara, Modena, Bologna
and Reggio-Emilia (Emilia-Romagna), the south plains of the province of Rovigo (Veneto) and the plain to the
south-east of the province of Mantova (Lombardy).
Average rank
7.400
7.600
8.000
8.000
8.100
8.500
8.600
8.700
8.800
9.000
Variable
Worldclim August Mean Temperature
Middle infra-red amplitude 1
Worldclim February Mean Temperature
Worldclim June Mean Temperature
Middle infra-red variance
EVI amplitude 3
Daytime LST amplitude 3
Daytime LST minimum
NDVI amplitude 2
NDVI variance
REFERENCES
- Capelli G, Ravagnan S, Montarsi F, Fabrizio S, Cazzin S, Bonfanti L, Di Gennaro A, Portanti O, Mulatti P, Monne I, Cattoli G, Cester G, Russo F, Savini G, Marangon S. Further evidence of lineage 2 West Nile Virus in Culex pipiens of North-Eastern Italy. Vet Ital. 2013 JulSep;49(3):263-8.
- Calzolari M, Bonilauri P, Bellini R, Albieri A, Defilippo F, Tamba M, Tassinari M, Gelati A, Cordioli P, Angelini P, Dottori M. Usutu virus persistence and West Nile virus inactivity in the Emilia-Romagna region (Italy) in 2011. PLoS One. 2013 May 7;8(5):e63978. doi:
10.1371/journal.pone.0063978. Print 2013.
- Mulatti P, Mazzucato M, Montarsi F, Ciocchetta S, Capelli G, Bonfanti L, Marangon S. Retrospective space-time analysis methods to support West Nile virus surveillance activities. Epidemiology and Infection 2014 ; 3 :1-12
- Pautasso A, Desiato R, Bertolini S, Vitale N, Radaelli MC, Mancini M, Rizzo F, Mosca A, Calzolari M, Prearo M, Mandola ML, Maurella C, Mignone W, Chiavacci L, Casalone C. Mosquito surveillance in northwestern Italy to monitor the occurrence of tropical vector-borne diseases.
Transbound Emerg Dis. 2013 Nov;60 Suppl 2:154-61. doi: 10.1111/tbed.12123.

